勾配とは
簡単にいうとスカラー場の各点における「最も急な上り坂の方向」と「その傾きの大きさ」を表すベクトルです。スカラー場を各軸で偏微分することで求めることができます。
2次元の場合、スカラー場 f(x,y)の勾配は:
今回は配列で表現されたスカラー場の勾配を求めて可視化します。 yoppa.orgのパーティクルをベクトル場に置いて動かすみたいなやつやりたいというのがモチベです。勾配を求められればスカラー場を地形に見立てて、地形に沿って流れるパーティクルとか作れそう。
配列で表現したスカラー場の微分の計算方法
そもそもの微分の定義は下記の式になります。
中心差分法 で近似する。
刻み幅hを1にして配列のデータを微分する。微分したいポイントの隣の値の差をとって平均を取るだけです。とても簡単。
dfdx = (f[x + 1] - f[x - 1]) / 2これを2次元配列に適応するとこうります。
dfdx = (f[x + 1][y] - f[x - 1][y]) / 2
dfdy = (f[x][y + 1] - f[x][y - 1]) / 2
関数化すると下記のようになる。スカラー場の2次元配列から勾配を求め、2次元ベクトルのベクトル場を返す。
interface Vector2D {
  x: number;
  y: number;
}

function createGradientField(scalarField: number[][]): (Vector2D | null)[][] {
  const num_of_rows = scalarField.length;
  const num_of_cols = scalarField[0].length;

  return Array.from({ length: num_of_rows }, (_, x) =>
    Array.from({ length: num_of_cols }, (_, y) => {
      //端にある要素はパスする
      if (x === 0 || x === num_of_rows - 1 || y === 0 || y === num_of_cols - 1) {
        return null;
      }
      const dx = (scalarField[x + 1][y] - scalarField[x - 1][y]) / 2;
      const dy = (scalarField[x][y + 1] - scalarField[x][y - 1]) / 2;
      return { x: dx, y: dy };
    })
  );
}
描画するコード
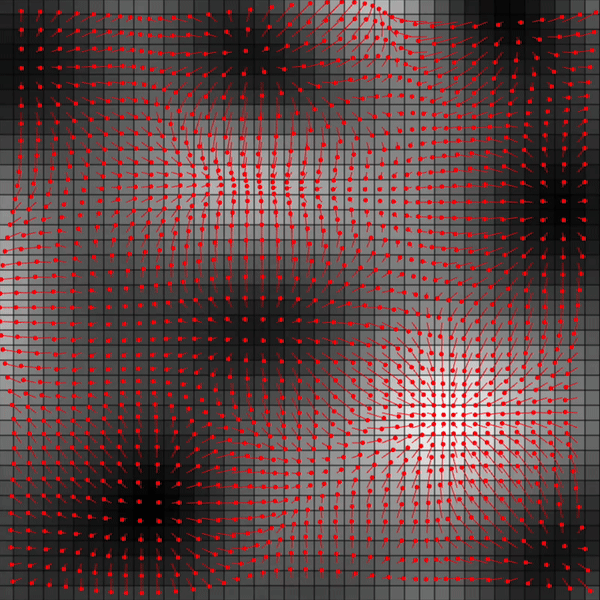
最終的なコードはこちら。パーリンノイズで生成したスカラー場とその勾配のベクトル場をpixe.jsで可視化しています。
import * as PIXI from 'pixi.js';
import { createNoise3D } from 'simplex-noise';

interface Vector2D {
  x: number;
  y: number;
}

const WIDTH = 800;
const HEIGHT = 800;
const NUM_OF_COLS = Math.floor(WIDTH / 20);
const NUM_OF_ROWS = Math.floor(HEIGHT / 20);

const timeScale = 0.1;
const frequency = 2.0;

let scalarField: number[][] = [];
let gradVectorField: (Vector2D | null)[][] = [];
let cellW: number, cellH: number;
let time = 0.0;

const noise3D = createNoise3D();

// スカラー場の関数
function calculateScalarValue(x: number, y: number, t: number, frequency: number = 1.0): number {
  const noiseValue = noise3D(x * frequency, y * frequency, t);
  return (noiseValue + 1) * 0.5;
}

// スカラー場の2次元配列を出力する
function generateScalarValue(time: number, num_of_rows: number, num_of_cols: number): number[][] {
  return Array.from({ length: num_of_rows }, (_, r) =>
    Array.from({ length: num_of_cols }, (_, c) => {
      const x = r / num_of_rows;
      const y = c / num_of_cols;
      return calculateScalarValue(x, y, time, frequency)
    }
    )
  );
}

// スカラー場の2次元配列から勾配を求め、ベクトル場を返す
function createGradientField(scalarField: number[][]): (Vector2D | null)[][] {
  const num_of_rows = scalarField.length;
  const num_of_cols = scalarField[0].length;

  return Array.from({ length: num_of_rows }, (_, x) =>
    Array.from({ length: num_of_cols }, (_, y) => {
      if (x === 0 || x === num_of_rows - 1 || y === 0 || y === num_of_cols - 1) {
        return null;
      }
      const dx = (scalarField[x + 1][y] - scalarField[x - 1][y]) / 2;
      const dy = (scalarField[x][y + 1] - scalarField[x][y - 1]) / 2;
      return { x: dx, y: dy };
    })
  );
}

// スカラーの配列受け取り、格子をcanvasに描画する
function drawScalarField(graphics: PIXI.Graphics, field: number[][]): void {
  const num_of_rows = field.length;
  const num_of_cols = field[0].length;

  Array.from({ length: num_of_rows }, (_, x) =>
    Array.from({ length: num_of_cols }, (_, y) => {
      const gray = Math.floor(field[x][y] * 255);
      const color = (gray << 16) | (gray << 8) | gray;

      graphics.rect(x * cellW, y * cellH, cellW, cellH);
      graphics.fill(color);
      graphics.stroke({ width: 1, color: 0x000000 });
    })
  );
}

//ベクトルを描画
function drawVector(graphics: PIXI.Graphics, start: Vector2D, end: Vector2D, color: number = 0xff0000): void {
  graphics.moveTo(start.x, start.y);
  graphics.lineTo(end.x, end.y);
  graphics.stroke({ width: 1, color });

  graphics.circle(end.x, end.y, 3);
  graphics.fill(color);
}

// 2次元ベクトルの配列を受け取り、ベクトル場を描画する。
function drawVectorsField(graphics: PIXI.Graphics, vectorField: (Vector2D | null)[][], scale: number = 300): void {
  const num_of_rows = vectorField.length;
  const num_of_cols = vectorField[0].length;

  Array.from({ length: num_of_rows }, (_, x) =>
    Array.from({ length: num_of_cols }, (_, y) => {
      if (!vectorField[x][y]) {
        return;
      }
      const start: Vector2D = {
        x: x * cellW + (cellW / 2),
        y: y * cellH + (cellH / 2)
      };
      const scaledVector: Vector2D = {
        x: vectorField[x][y].x * scale,
        y: vectorField[x][y].y * scale
      };
      const end: Vector2D = {
        x: start.x + scaledVector.x,
        y: start.y + scaledVector.y
      };

      drawVector(graphics, start, end);
    })
  );
}


async function init() {
  const app = new PIXI.Application();

  await app.init({
    width: WIDTH,
    height: HEIGHT,
    backgroundColor: 0xdddddd,
    antialias: true
  });

  document.getElementById('app')!.appendChild(app.canvas);

  cellW = WIDTH / NUM_OF_ROWS;
  cellH = HEIGHT / NUM_OF_COLS;

  const graphics = new PIXI.Graphics();
  app.stage.addChild(graphics);

  app.ticker.add(() => {
    graphics.clear();
    time = Date.now() / 1000.0 * timeScale;

    scalarField = generateScalarValue(time, NUM_OF_ROWS, NUM_OF_COLS);
    gradVectorField = createGradientField(scalarField);

    drawScalarField(graphics, scalarField);
    drawVectorsField(graphics, gradVectorField);
  });
}

init();
依存関係
{
  "name": "gradient",
  "private": true,
  "version": "0.0.0",
  "type": "module",
  "scripts": {
    "dev": "vite",
    "build": "tsc && vite build",
    "preview": "vite preview"
  },
  "devDependencies": {
    "typescript": "~5.8.3",
    "vite": "^7.0.4"
  },
  "dependencies": {
    "pixi.js": "^8.11.0",
    "simplex-noise": "^4.0.3"
  }
}
実行結果
先端に丸い点がついている赤い線がベクトルを可視化したもので、孔子の濃淡がスカラー場を可視化したものです。
赤い線(先端に丸い点)がベクトルを表し、色の濃淡がスカラー場を表しています。 ベクトルが濃淡の差が大きい方向を向いており、色の差の大きさに比例して長さが変わっていることがわかると思います。